
Armchair Primary Predictions - Did demographics decide the 2016 primaries?
Many people made predictions about this year’s primary, and many of these predictions turned out to be wrong. I don’t need to retread all of this information here, but suffice to say many people underestimated Donald Trump and Bernie Sanders.
When it was clear that their predictions were wrong, these same experts offered simple explanations for the surprising results. I was interested in looking into this and checking whether the primaries were really so hard to predict, and what I could see about what was driving support for the candidates.
Objective
I used demographic information that was available in 2014. This included information about employment, ethnicity, population, and living arrangements. Since the model did not use polls, the results can be interpreted as the degree to which demographics decided the outcome of the primaries.
I used data from the US Census. Some of it was preprocessed for a Kaggle Competition, and I got the rest directly from the American Fact Finder. I scraped information about the primaries from Election Central. I created maps using Vincent, and I downloaded the underlying shapefiles from the US Census Bureau’s TIGER program.
The model also used information about the primaries, like the date they were held and how they were structured (open/closed/caucus). The date was important because it tracked changes over time. In particular, Trump’s support increased over time and I thought it was important to control for this shift.
The main strength of this approach is that it beats the hell out of the predictions that the experts made during the primaries. Its biggest weakness is that it relies on the results of some primaries to make predictions for others, so I was not able to make predictions before Super Tuesday (March 1). This is a serious drawback but, observing the results this year, one wonders whether anyone should have made predictions before Super Tuesday.
I will show a series of results that illustrate my model’s performance in a variety of circumstances. I’ll start with a rolling model, that makes predictions for each primary based on the primaries that already happened. For example, the first prediction is made on Super Tuesday (March 1).
Basic Model: Donald Trump
I trained a Logistic Regression classifier (with sklearn) to predict whether Donald Trump would win each county. I used L2 regularization (lambda = 0.1), and I normalized the inputs before training so I could interpret the model coefficients.
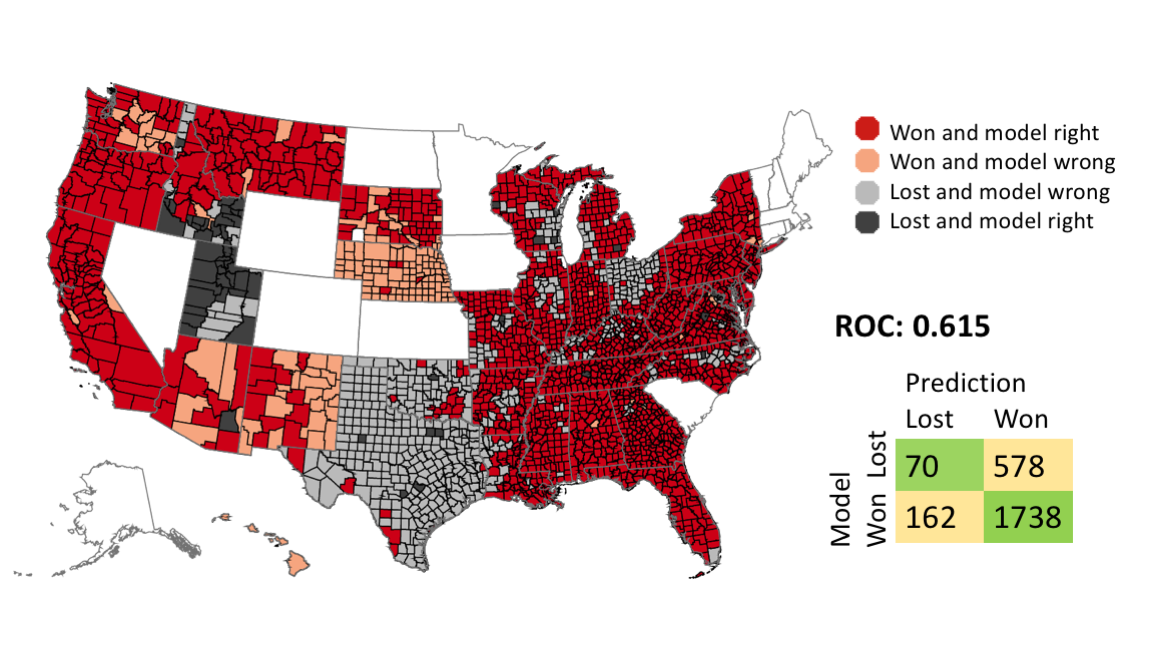 |
Most of the false predictions come from Ohio and Texas. There is a simple explanation for this: my model does not know that Ted Cruz is from Texas, and John Kasich is from Ohio, so it was unable to factor that into its predictions. It was not clear how to include this information with my modeling scheme without cheating.
Several states are missing from the predictions, and they shown in plain white on the map. There are two reasons for this:
- Some states do not use counties as primary districts. These states are Alaska, Connecticut, Illinois, Kansas, Maine, Massachusetts, North Dakota, New Hampshire, Rhode Island, Vermont, and Wyoming. I did not include these states in my model because it did not fit into my modeling scheme. The US Census does not distribute shapefiles or data for these districts. In order to include them, I would have to get shape files from each state, and then map them to census tracts.
- I did not make predictions for states that held their primaries before Super Tuesday. These states were used as the minimal training set for the Super Tuesday primaries. The states used in the minimal training set were Iowa, Nevada, and South Carolina.
Top 10 model features:
| Model Coefficient | Feature name |
|---|---|
| 8.013 | Percent Unemployment, 2014 |
| 5.803 | White alone, not Hispanic or Latino, percent, 2014 |
| -5.463 | Hispanic or Latino, percent, 2014 |
| 5.340 | Foreign born persons, percent, 2009-2013 |
| 4.413 | Hispanic-owned firms, percent, 2007 |
| -4.125 | Bachelor’s degree or higher, percent of persons age 25+, 2009-2013 |
| 3.341 | Black or African American alone, percent, 2014 |
| -3.292 | Persons under 18 years, percent, 2014 |
| 3.129 | Date of Primary |
| -3.011 | Housing units in multi-unit structures, percent, 2009-2013 |
Some observations:
- Unemployment was the best predictor of Trump support. This does not mean that Trump supporters are unemployed, but rather that they live in counties with high unemployment. Nate Silver wrote an uncharacteristically insightful article on this topic.
-
A county’s proportion of white residents predicted Trump support, and the opposite was true for the proportion of Hispanic or Latino residents.
- Surprisingly, a higher percentage of foreign-born residents, black residents, and Latino-owned businesses predicted more support for Trump. I suspect that this is the result the Logistic Regression model combining correlated inputs to create complex features. This would not be possible with a linear model that was solved algebraically, but logistic regression is trained through parameter optimization, so it does not have the same constraints.
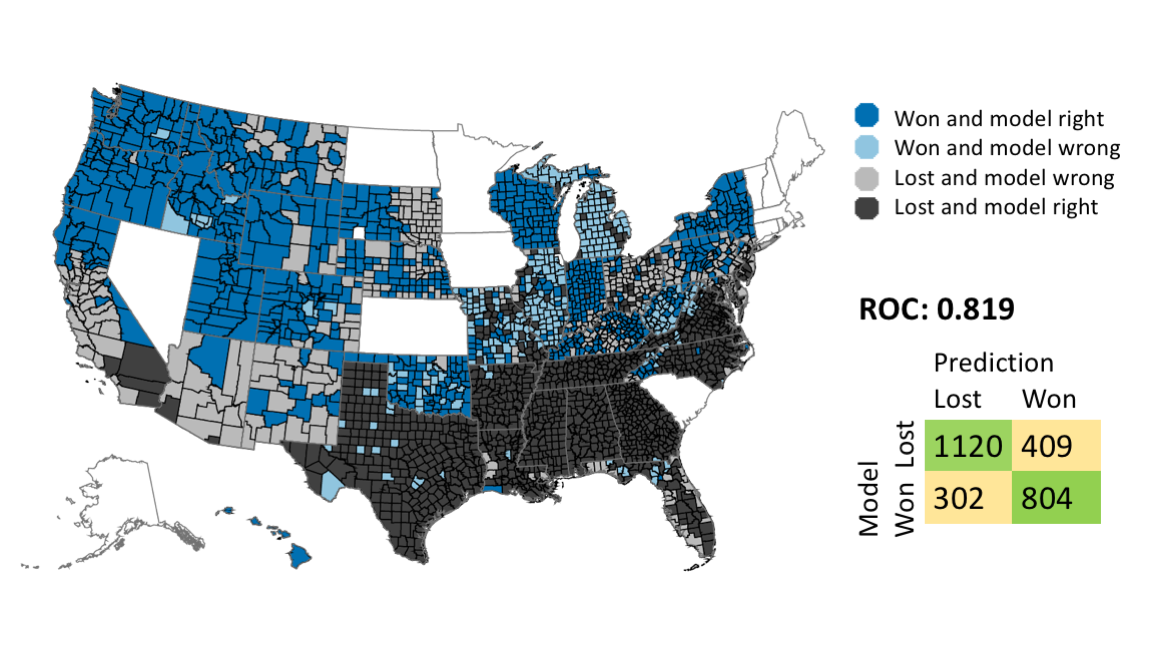
Basic Model: Bernie Sanders
I produced a similar model for Bernie Sanders.
 |
Top 10 model features:
| Model Coef | Feature name |
|---|---|
| 12.068 | Two or More Races, percent, 2014 |
| -10.075 | Black or African American alone, percent, 2014 |
| 7.098 | High school graduate or higher, percent of persons age 25+, 2009-2013 |
| 5.750 | Date of primary |
| -4.506 | Black-owned firms, percent, 2007 |
| -3.643 | Female persons, percent, 2014 |
| -3.486 | Veterans, 2009-2013 |
| 3.212 | American Indian and Alaska Native alone, percent, 2014 |
| 3.097 | Foreign born persons, percent, 2009-2013 |
| 2.338 | Persons below poverty level, percent, 2009-2013 |
There are a few interesting things here.
-
The best feature for predicting where Sanders would win is the percentage of the population that identifies as biracial. This could mean that Bernie Sanders won the biracial vote, or it could be a proxy for other factors. A person with one Asian parent and one white parent might consider themselves biracial, only Asian, or only white, and this choice has political significance.
-
The date of the primary is the 4th most predictive variable. This could be a coincidence, but it could also mean that Bernie Sanders gained momentum over the course of the primary cycle.
-
The percentage of black residents strongly predicted against Sanders support. Combined with the biracial feature, this means that counties with large numbers of non-black biracial people went strongly for Sanders. The high school graduation rate and the percentage of foreign born people predicted support for Sanders. The percentage of veterans predicted against Sanders support.
Predicting the outcome over time
The models above show the predictions I would make on the eve of each primary. There is another, equally interesting, question to ask with this data. How soon would I have been able to call the result of the primary process? That is, if I predicted the outcome of the entire contest at each point, how well would I do?
Trump
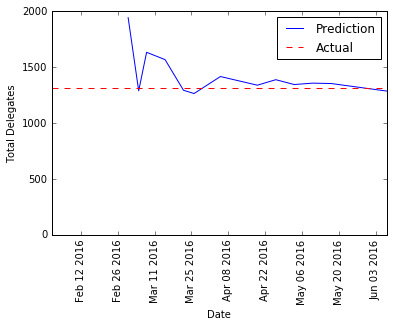 |
The prediction before Super Tuesday is way off, but the model became accurate pretty quickly. By the end of march, the model’s predictions were within a few hundred votes of the target.
Sanders
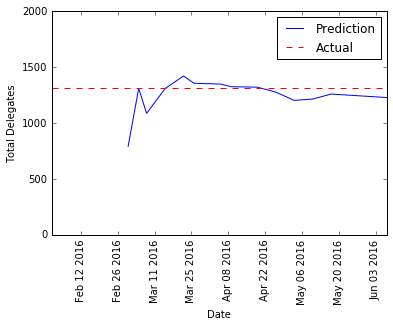 |
Again, the model’s prediction before Super Tuesday is way off, but the prediction stabilized in mid-march.
Conclusions
The 2016 primary may have been shocking, but by the end of March the results were pretty predictable.
Ideas for the future
- Include the missing states. This requires downloading the relevant shapefiles from each district, and combining them into a single map. U.S. census data is not available for townships, so I will need to download data in census tracts and then combine them to form townships.
- Improve the vote estimates. I was not able to figure out exactly how each state divided up its delegates, so I made estimates by dividing the total delegates for each state among the population in each county, and then awarding the delegates proportionally. This ignores the complicated formulas that many states use, especially on the republican side.